
Learn R Programming & Analysis
Learn R Programming & Analysis — Write R code, then see the chart and the table
Learn R Programming & Analysis is an iOS and Android app for R programming aimed at data analysis and statistics. You read a short lesson, write R code in the built-in editor, run it, and the chart or data table appears in the app. 43 courses run from your first vector to regression, with an AI mentor and interactive statistics simulators alongside.

- Price
- Free, Pro upgrade
- Platforms
- iOS and Android
- Languages
- 22
- Age rating
- 4+
- Code runner
- R 4.0, needs an internet connection
- Requires
- iOS 15.1 or later
- App Store
- 5.0 ★ (1)
R was made for data, so the output matters as much as the code.
A print statement is not much of a reward in R. The payoff is a histogram, a sortable table or a fitted line. That is why this app shows plot(), hist(), boxplot() and barplot() drawings and data frames as real tables right after a run, instead of leaving you with a wall of text.
What it is
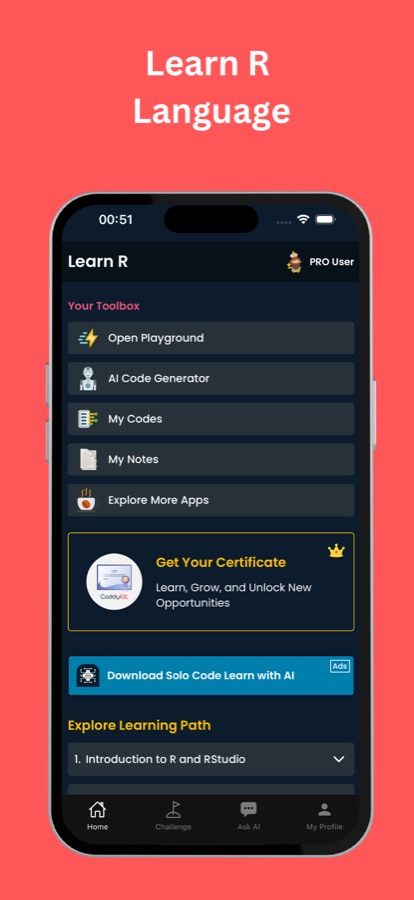
Learn R Programming & Analysis is a mobile R tutorial, R course and code editor for iOS and Android. It has 43 courses with 159 lessons, graded A1 to C1, covering vectors and data frames, dplyr and tidyr, ggplot2 charts, exploratory data analysis, probability and statistics, then advanced topics such as tidymodels, Shiny and Bayesian statistics with RStan. The editor runs your code on a real R 4.0 interpreter on the app's servers, so it needs an internet connection, and an AI mentor can explain an error message, a table or a chart.
Inside the app
What it looks like
The course
What the R course covers
43 courses and 159 lessons from the app's own course list, graded A1 to C1. These eight stages give the shape of the path.
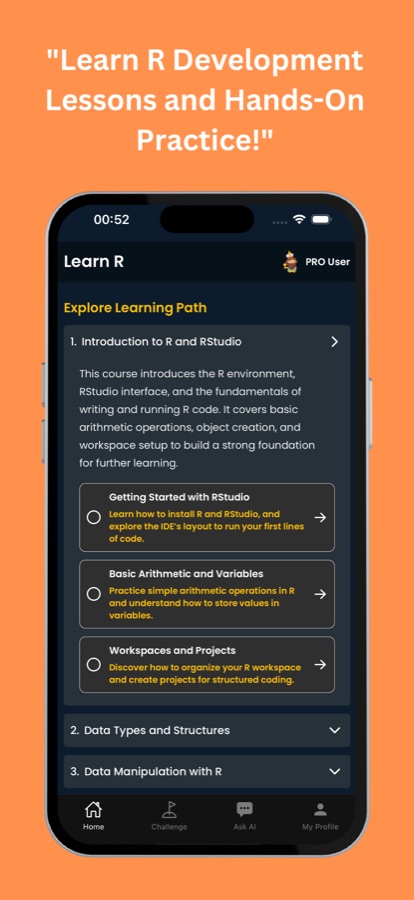
Welcome to R and Introduction to R and RStudio
Installing R, finding your way around RStudio, basic arithmetic, creating objects and keeping a tidy workspace.
Data Types and Structures, Matrices, Missing Values
Vectors, matrices and factors, sequences, type conversion, and how NA and NaN behave in calculations.
Functions, Control Flow, Strings and Dates
Writing functions, if and loop logic, debugging, string formatting, working with dates, and sorting and ranking values.
Data Manipulation and the Tidyverse
Filtering and summarising with dplyr, reshaping with tidyr, and reading files with readr and readxl.
Data Visualization
Plotting with base R first, then layered charts with ggplot2.
Exploratory Data Analysis and Statistics
Describing a dataset, probability, simulation and statistical analysis, with simulators to see each idea move.
Functional Programming, Modelling and Shiny
purrr, machine learning with tidymodels, random forests, Shiny applications and Plumber APIs.
Specialist and Advanced Topics
Text mining, geospatial analysis, package development, performance and parallel computing, and Bayesian statistics with RStan.
How it works
A typical study session
A session alternates between understanding an idea and checking it against real output, so the result of each concept is something you can look at.
Open today's lesson
Pick up where you left off or choose a topic from the learning path. Each lesson starts with a short plain-language explanation and a quick question to confirm the idea landed.
Edit the code and run it
Open the R editor, change the example and run it. Text results go to the console, plot calls draw a chart, and a data frame appears as a sortable table with a column summary and NA values highlighted.
Ask when something is unclear
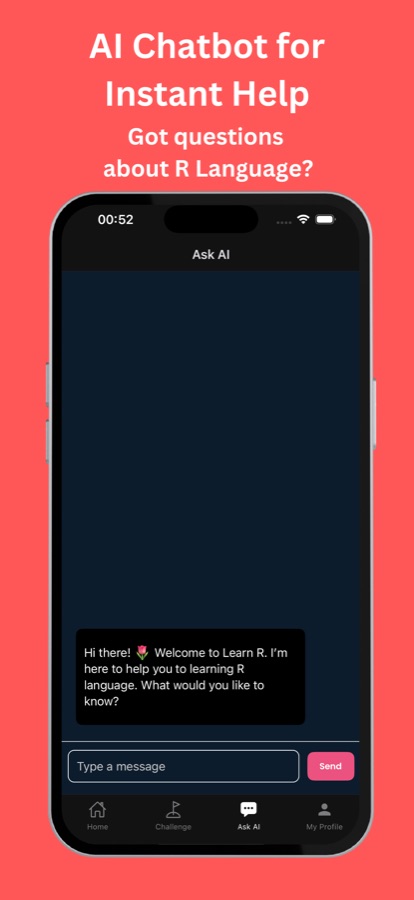
If an error message is cryptic, the R Error Doctor puts it into plain language and suggests a fix. For an output, a table or a chart you do not understand, the AI data mentor explains what it shows.
Practise with data you can touch
Work through guided tasks on built-in datasets such as mtcars, iris and airquality, build an analysis cell by cell in the notebook, or import a CSV of your own.
What's inside
What is inside the app
43
R courses, 159 lessons
A learning path graded A1 to C1: vectors, matrices, factors, strings and dates, control flow, data manipulation, visualization, statistics, and advanced topics such as Shiny apps and Plumber APIs.
Charts
Plots and tables from your own code
plot(), hist(), boxplot() and barplot() draw inside the app, and data frames show as tables you can sort, with a column summary and missing values marked.
12
Statistics simulators
Interactive workshops for the normal curve, the central limit theorem, p-values, correlation, fitting a line, sample size and boxplot anatomy, each showing the R code behind what you move.
Datasets
Dataset Lab and R Notebook
Guided tasks on mtcars, iris, airquality and five practice CSV files, plus a cell-by-cell notebook for building your own analysis. You can also import your own CSV.
Error Doctor
Plain-language R errors
The R Error Doctor rewrites cryptic error messages in plain words and suggests a fix, using a base R approach where one exists.
Projects
Analysis projects and missions
3 end-to-end analysis projects with a shareable report card, 20 guided coding projects and 60 missions at easy, medium and hard levels.
Background
What is R used for, and is it a good first programming language?
R is a language built for statistics and data analysis. Researchers, analysts, biostatisticians, economists and psychologists use it to clean data, summarise it, test a hypothesis and draw the result as a chart. It is a reasonable first language when your goal is data, because even a short script produces something meaningful: a mean, a regression line, a plot. It is a weaker choice if you want to build websites or mobile apps, where a general-purpose language fits better.
Vectors firstthe idea behind everything else
In R a single number is just a vector of length one, and most operations work on a whole vector at once. Once that clicks, loops become rarer and code gets shorter, which is also why R feels odd to people arriving from other languages.
Data framesR's version of a spreadsheet
A data frame is a table where each column holds one kind of value and each row is one observation. Built-in practice sets such as mtcars and iris are data frames, and nearly every analysis you will read starts by loading or building one.
Missing values (NA)the first surprise in real data
R marks an unknown value as NA and refuses to guess. A mean of a column containing a single NA is itself NA until you say how to treat it, which is why handling missing values is an early skill rather than an advanced one.
Base R and the tidyversetwo ways to say the same thing
Base R is what ships with the language. The tidyverse is a family of packages (dplyr, tidyr, ggplot2, readr) that many analysts prefer for reshaping data and drawing charts. Most real-world R code mixes both, so it helps to read each style.
Fit
Who it's for — and who it isn't
A good fit if you
- Are taking a statistics, biostatistics, psychology or economics class that uses R
- Work in spreadsheets and want to move your analysis into code
- Want a first programming language that is made for data rather than for websites
- Want to read R code and understand what a statistical result is saying
- Learn best by changing a line and seeing the chart redraw
Not the right tool if you
- Need to run dplyr, ggplot2 or tidymodels yourself on the phone: the in-app runner is base R 4.0, so those lessons teach the code and the ideas, and you run the packages on a computer
- Expect to code offline: the editor sends your code to the app's servers, so it needs a connection
- Want everything free: the first course is free, and Pro unlocks the rest
- Are looking for a general web or app development course
Questions
Frequently asked questions
What is the best way to learn R programming on a phone?
Look for an app that lets you run R and shows the output, because R's value is in charts, tables and statistical results. Learn R Programming & Analysis has a built-in editor connected to a real R 4.0 interpreter, so plots and data frames appear after each run. Short lessons, a notebook and 12 statistics simulators sit around it, and the app is free to start on iOS and Android.
Does the app run real R code, or only show examples?
It runs real R. Your code goes to an R 4.0 interpreter on the app's servers and the result comes back as text, a chart or a table. Because that happens online, Learn R Programming & Analysis needs an internet connection whenever you press run.
Can I use dplyr and ggplot2 inside the app?
The lessons teach dplyr, tidyr, ggplot2 and other tidyverse packages, but the in-app runner is base R 4.0 with its recommended packages. To run packages such as dplyr, ggplot2 or tidymodels yourself, use R on a computer. Where a base R way exists, the R Error Doctor in Learn R Programming & Analysis shows it.
Is R a good first programming language for data analysis?
Yes, if data is the goal. R was designed for statistics, so summarising a column, drawing a histogram or fitting a line takes a few lines. Learn R Programming & Analysis assumes no experience and starts with installing R and storing values in variables, then moves to data frames and charts.
What can I practise on besides the lessons?
Learn R Programming & Analysis includes a Dataset Lab with mtcars, iris, airquality and five practice CSV files, each with guided tasks, and you can import your own CSV. There is also an R Notebook for building an analysis cell by cell, 60 coding missions and a daily data puzzle.
What are the statistics simulators?
They are 12 interactive workshops where you move a slider and watch the result change: the normal curve, the central limit theorem, p-values, correlation, fitting a line, sample size, boxplot anatomy and more. Each one shows the R code behind it, so the idea and the syntax are tied together in Learn R Programming & Analysis.
Is Learn R Programming & Analysis free?
It is free to download and the first course, Welcome to R, is free. The free version includes a preview of every lesson, the R editor, the Error Doctor, 6 of the 12 simulators, 3 datasets, 1 guided project, 1 analysis project, 2 missions and a daily AI mentor allowance, and it shows ads. Pro unlocks every course, all projects, simulators and datasets, the exam and certificate, and removes ads. The app is listed as Learn R Programming & Analysis on Google Play and as Learn R: Data Analysis & Code on the App Store.
How does Pro billing work?
Pro is a weekly, monthly or yearly subscription, or a one-time lifetime purchase. You choose when the offer appears in the app, and a purchase is handled by the App Store or Google Play.
Is there a certificate?
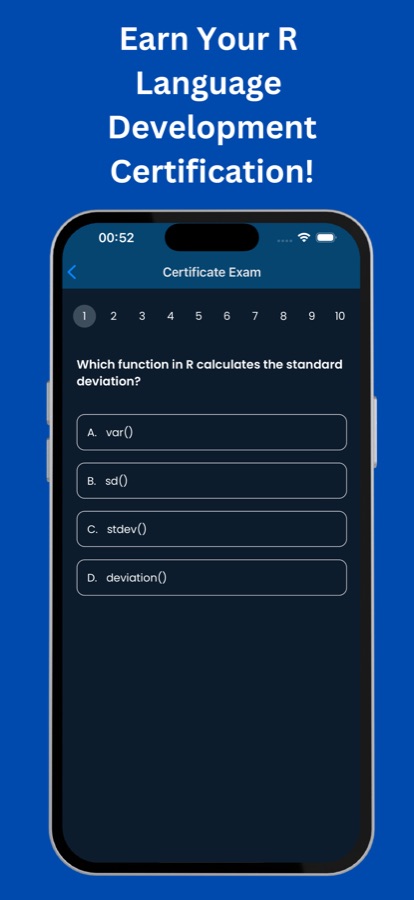
Yes. Passing the final exam in Learn R Programming & Analysis gives you an R certificate of completion, which is part of Pro. It shows you finished the course material; it is not an academic qualification.
Is the app connected to the R Foundation or Posit?
No. Learn R Programming & Analysis is an independent app and is not affiliated with or endorsed by the R Foundation or Posit. It is available on iOS and Android in 22 languages.
Get started
Run your first line of R today
Free to start on iOS and Android, in 22 languages.
More from CoddyKit
Available on iOS and Android.