

Calculus & Probability Lab
Calculus & Probability Lab — Drag the curve, see the derivative
Calculus & Probability Lab is a calculus and statistics app that replaces static textbook graphs with 3D surfaces you drag, orbit and reshape live. Move a point along a curve and watch its derivative update in real time, stack Riemann rectangles into a definite integral, or roll physics-simulated dice until the histogram settles into the bell curve — across 50 lessons in four worlds.


- Price
- Free, Pro upgrade
- Platforms
- iOS and Android
- Languages
- 10
- Age rating
- 4+
- Version
- 1.2.0
- Requires
- iOS 15.1 or later
Drag first, memorize never.
A derivative written as a formula is an abstraction until a slope actually tilts as you drag a point along the curve. Calculus & Probability Lab treats that as the starting point rather than the reward at the end — every rule in the app shows up as something you move with your finger before it shows up as notation.
What it is
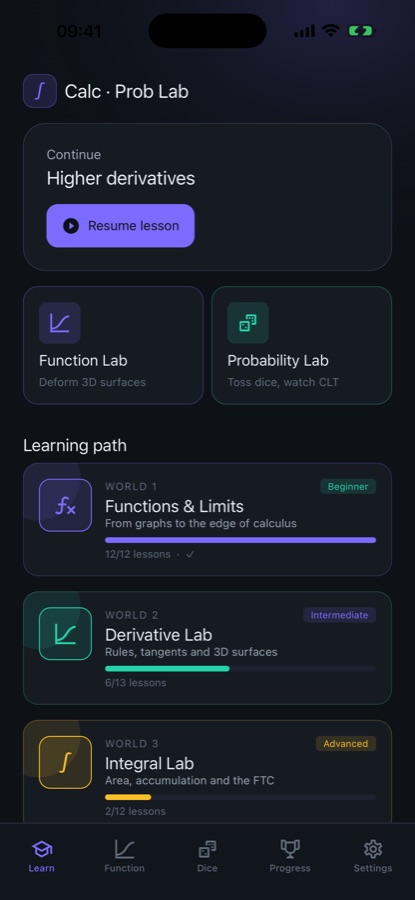
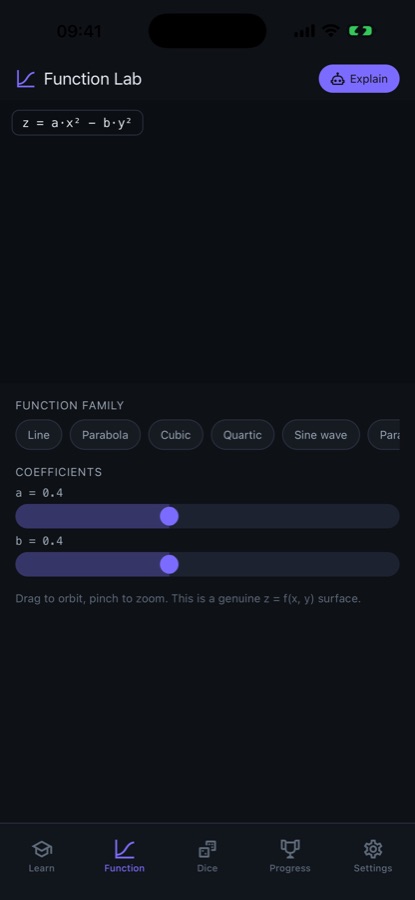
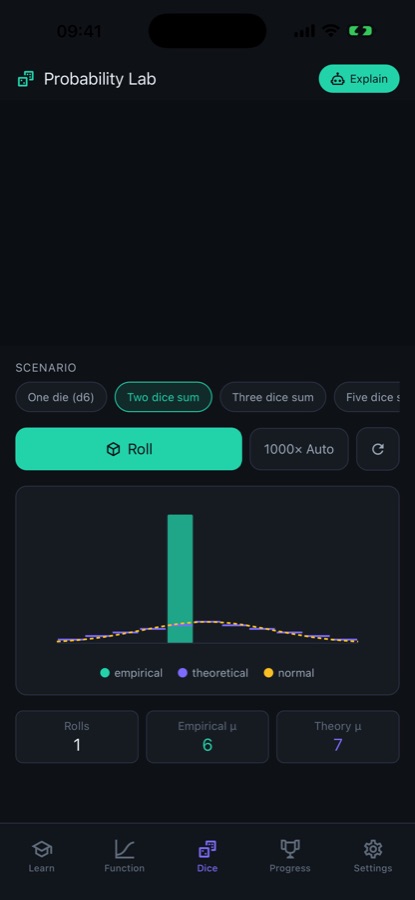
Calculus & Probability Lab is an app for learning calculus and probability through interactive 3D visualization instead of static diagrams. A Function Lab renders 22 function families and genuine z = f(x, y) surfaces that you orbit and reshape with sliders, with a live tangent-line overlay and a Riemann sum overlay that converges to the exact definite integral as you add rectangles. A Probability Lab tosses physics-simulated dice to build a real empirical histogram and overlays it against the exact theoretical distribution, so the Central Limit Theorem shows up as something that happens on screen rather than a claim in a textbook. A learning path of 50 lessons across 4 worlds links straight into the matching lab, and an AI tutor explains whatever surface, formula or distribution is currently on screen.
Inside the app
What it looks like

Background
Why is visualizing calculus and probability different from reading about them?
Calculus and probability are usually taught as formulas to apply correctly on an exam, which leaves a gap between knowing a rule and understanding why it holds. A derivative is a slope, a definite integral is an area, and a probability distribution is a shape that real random outcomes settle into given enough trials — all three are visual ideas before they're symbolic ones, and seeing them move under your own input closes a gap that a static graph in a textbook cannot.
Derivative as a moving tangent lineslope, not a formula to memorize
Dragging a point along a curve and watching the tangent line's slope update in real time turns the derivative into a quantity you can watch change, rather than an expression you differentiate on paper and trust is correct. The power, product, quotient and chain rules each produce a different, visible tangent behavior at different points on the same curve.
Riemann sums and the definite integralrectangles approaching an exact area
A Riemann sum approximates the area under a curve using a fixed number of rectangles; as the rectangle count increases from one toward sixty, the sum visibly converges on the exact definite integral given by the Fundamental Theorem of Calculus. Watching that convergence happen, rather than being told it happens, is what connects the discrete approximation to the continuous answer.
z = f(x, y) surfacesfunctions of two variables
A function of two variables produces a surface in three dimensions rather than a curve in two — a paraboloid, a saddle, a Gaussian hill. Orbiting and reshaping that surface by dragging its coefficients is a way to build intuition for partial derivatives and critical points before working through the algebra behind them.
The Central Limit Theorem, shown with diceempirical results approaching the normal curve
The Central Limit Theorem predicts that, given enough trials, the sum of independent random outcomes — dice rolls, coin flips — approaches a normal distribution regardless of the shape of the individual outcomes. Rolling physics-simulated dice repeatedly and watching an empirical histogram close in on that predicted bell curve is a direct, hands-on demonstration of a theorem that's often taught only as a formula.
How it works
How the app is used
The learning path and the two interactive labs are built to reinforce each other: a lesson introduces an idea, and its matching lab is one tap away to make the idea tangible.
Work through a lesson
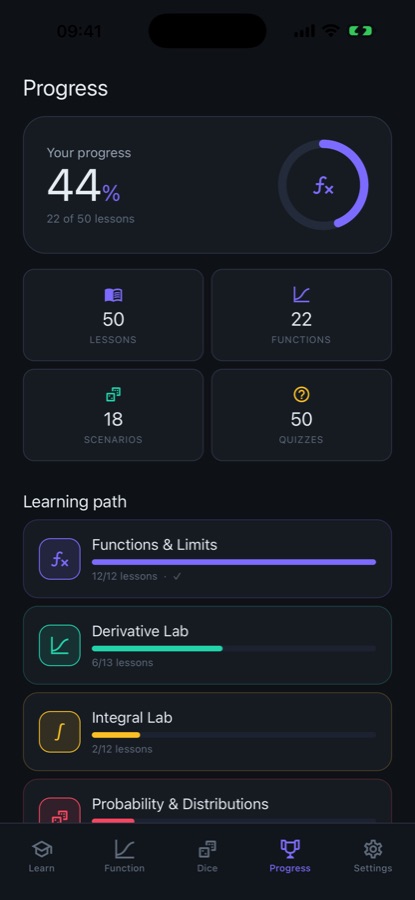
Each of the 50 lessons across Functions & Limits, Derivative Lab, Integral Lab and Probability & Distributions builds on the last, from what a function is through the Fundamental Theorem of Calculus to binomial and Poisson models.
Open the matching lab
Every lesson deep-links into the 3D Function Lab or the dice-based Probability Lab covering exactly that idea, so a concept just introduced in text becomes something you can drag, orbit or roll immediately.
Ask the AI tutor to explain what's on screen
Tap Explain on any surface, formula or dice distribution for a plain-language breakdown of your specific coefficients, your specific slope, or your specific mean and standard deviation — not a generic textbook definition.
What's inside
What's inside the two labs
22
Function families
Lines, parabolas, cubics, quartics, sine and cosine waves, exponentials, natural logs, reciprocals, square roots, Gaussian bumps and logistic S-curves, each rendered as a closed-form, exact graph with no approximation or drift.
3D
Genuine z = f(x, y) surfaces
Paraboloids, saddles, Gaussian hills, ripples, sphere caps, cones, tilted planes, monkey saddles and egg-carton surfaces, all built to drag for orbiting and pinch for zooming.
Live
Tangent-line and Riemann sum overlays
Move a point along any curve to watch its derivative recompute live, or slide from 1 to 60 rectangles to watch a Riemann sum converge on the exact definite integral.
18
Probability scenarios
Dice-sum outcomes across d4, d6 and d20, coin-flip binomial trials and Poisson arrival processes, each built from a physics-simulated toss rather than a random-number shortcut.
50
Lessons across 4 worlds
Functions & Limits, Derivative Lab, Integral Lab, and Probability & Distributions, with quiz questions per lesson and a wrong answer that names the specific mistake behind it.
AI
AI tutor and AP exam practice
Tap Explain for a plain-language breakdown of whatever's on screen; a study plan counts back from an entered AP Calculus AB exam date, with free-response practice graded point by point against a rubric.
Fit
Who it's for — and who it isn't
A good fit if you
- Are in AP Calculus AB, a first college calculus or statistics course, and want to see a rule before memorizing it
- Learned calculus once, forgot most of it, and want the visual intuition back rather than a formula refresher
- Want to actually watch the Central Limit Theorem happen instead of taking it on faith from a textbook
- Prefer dragging a 3D surface to reshape it over reading a static graph in a PDF
- Are counting down to an AP Calculus AB exam and want a study plan built around the actual date
Not the right tool if you
- Want every lesson and function family for free — 38 of 50 lessons and 16 of 22 function families are Pro
- Need unlimited dice rolls daily on the free tier — the free plan caps rolls per day
- Are looking for a full multivariable or differential equations course; the app covers single-variable calculus plus an introduction to z = f(x, y) surfaces and core probability
- Want the AI tutor and free-response grading without any daily limit on the free tier
Privacy
What the AI tutor and exam grading send
Tapping Explain sends the specific surface, formula or distribution you're looking at — your coefficients, your slope, your dice results — to an AI service so it can generate a plain-language explanation of that exact case. Free-response practice answers are sent for AI grading against a rubric in the same way. Progress, lesson completion and saved lab setups are tracked within the app.
Full details are in the CoddyKit privacy policy.
Questions
Frequently asked questions
What's a good app for visualizing calculus?
The most useful kind lets you move something and see the math respond immediately — a tangent line that updates as you drag a point, or an integral that converges as you add rectangles — rather than showing a fixed, already-solved graph. Calculus & Probability Lab is built around that: 22 function families and true 3D z = f(x, y) surfaces you orbit and reshape, with a live tangent-line overlay and a Riemann sum overlay tied to 50 lessons across 4 worlds.
How does the Riemann sum overlay work?
You pick a curve and a range, then slide a control from 1 up to 60 rectangles. At low rectangle counts the sum is visibly rough; as the count climbs, the total area of the rectangles converges on the exact definite integral given by the Fundamental Theorem of Calculus. Watching the convergence happen is the point — it connects a discrete approximation technique to the continuous answer it's estimating.
What is a z = f(x, y) surface, and why does it matter for calculus?
It's a function of two input variables, which produces a surface in three dimensions instead of a curve in two — a paraboloid, a saddle, a Gaussian hill, and similar shapes. Multivariable calculus concepts like partial derivatives and critical points are easier to build intuition for when you can orbit and reshape the actual surface, rather than only working through the algebra for a shape you've never seen.
How does the dice simulator demonstrate the Central Limit Theorem?
The Probability Lab tosses physics-simulated dice repeatedly and builds a real empirical histogram from the results, overlaid against the exact theoretical distribution for that scenario. The Central Limit Theorem predicts that sums of independent random outcomes approach a normal distribution as trials increase — rolling enough times and watching the histogram visibly close in on that predicted bell curve turns an abstract theorem into something you watched happen.
Is Calculus & Probability Lab useful for AP Calculus AB?
Yes — enter an AP Calculus AB exam date and the app builds a day-by-day study plan counted back from it, alongside one AP-style free-response justification question per world that's graded point by point against a rubric by AI, and a 60-second warm-up drill weighted toward topics you've missed. AP is a trademark of the College Board, which is not affiliated with this app.
What does the AI tutor actually explain?
Tapping Explain on a surface, formula or dice distribution gets a plain-language breakdown tied to the specific numbers currently on screen — your coefficients, your slope at that point, your mean and standard deviation from your own dice rolls — rather than a generic definition pulled from a textbook.
Is Calculus & Probability Lab free?
The first 3 lessons of every world (12 of 50 total), 6 function families, 4 dice scenarios, a daily dice-roll allowance, a limited number of daily AI explanations and free-response gradings, and the study plan and warm-ups are free, with ads. Pro removes ads and unlocks all 50 lessons, all 22 function families, all 18 dice scenarios, unlimited rolls and AI explanations, and more daily free-response gradings.
What calculus topics does the learning path cover?
Four worlds in order: Functions & Limits (function families, slope, limits, continuity), Derivative Lab (power, product, quotient and chain rules, partial derivatives, related rates, optimization, the Mean Value Theorem), Integral Lab (Riemann sums, the Fundamental Theorem of Calculus, area between curves, volumes of revolution), and Probability & Distributions (sample spaces, expected value, binomial and Poisson models, the normal curve).
Can the app be used to relearn calculus after forgetting it?
Yes — World 1, Functions & Limits, doubles as a refresher covering what a function is, families of functions, slope, limits and exponentials and logs, before Derivative Lab and Integral Lab move into calculus proper. Because every lesson links to its matching 3D or probability lab, rebuilding the visual intuition doesn't require re-deriving every rule from scratch first.
Get started
Watch the derivative happen
Free to start, with a Pro upgrade for every function family, lesson and dice scenario.
More from CoddyKit
Available on iOS and Android.