
Profiling intro (Node/DevTools) — tiny timing habits
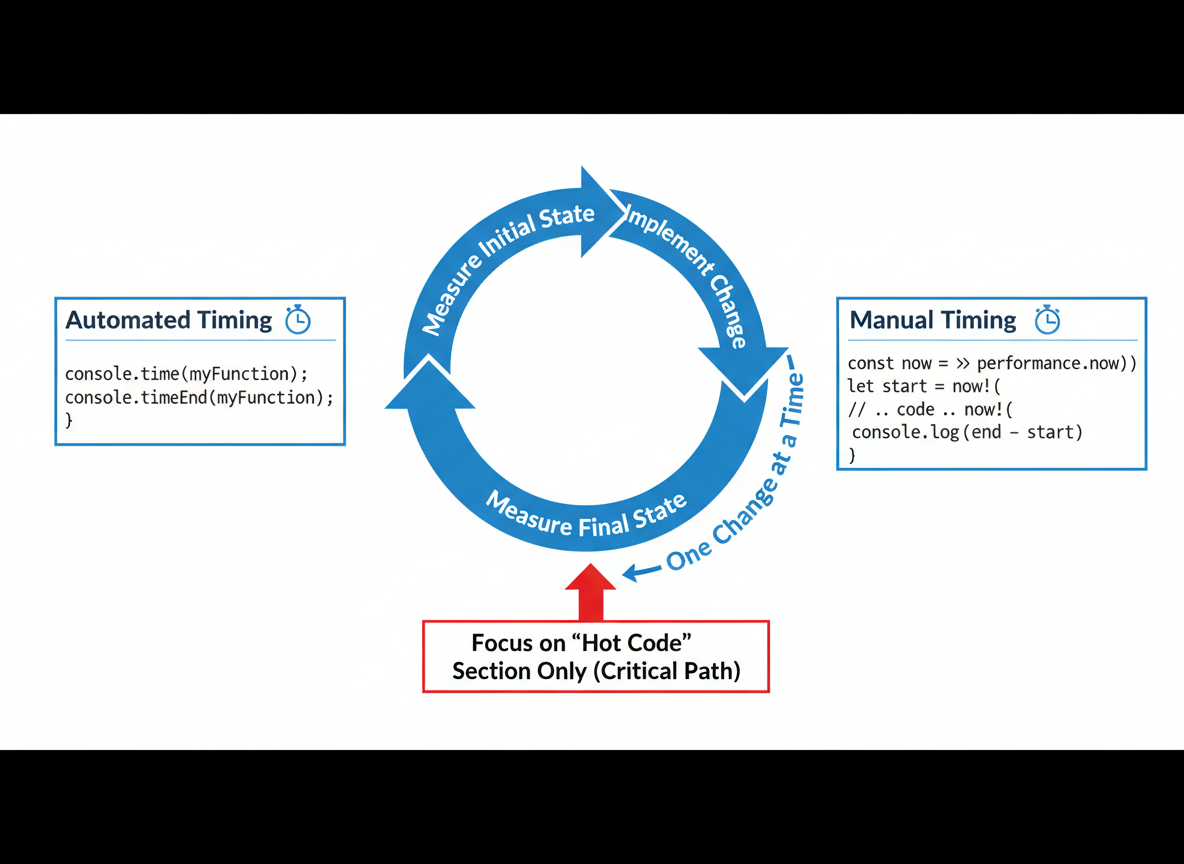
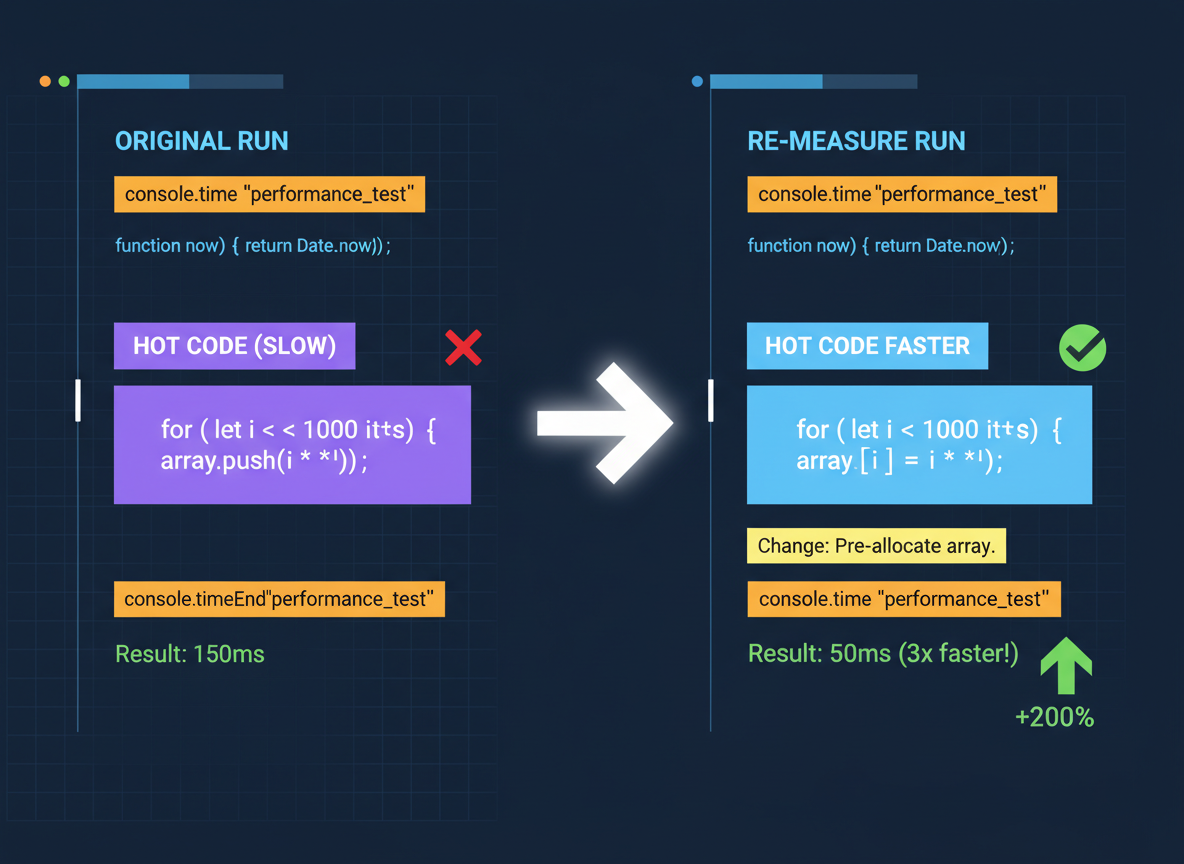
Profile in tiny steps: measure with console.time/timeEnd and simple timers, find hot code, change one thing, and re-measure.
Profiling intro (Node/DevTools) — tiny timing habits is a free JavaScript Academy lesson on CoddyKit. This is lesson 3 of 3. Any 3 lessons of this learning path are free to read in full — after that, CoddyKit PRO unlocks every lesson, plus hands-on practice with a built-in code editor and a 24/7 AI tutor. It is part of the JavaScript Academy learning path, and your progress syncs across the web and the CoddyKit app. The JavaScript Academy course includes 3 lessons in total.
Why profiling?
Goal: Measure → change → measure again.
- Use console.time/timeEnd for quick timing
- Use a tiny now() helper for manual timings
- Focus on hot code only
- Make one change at a time
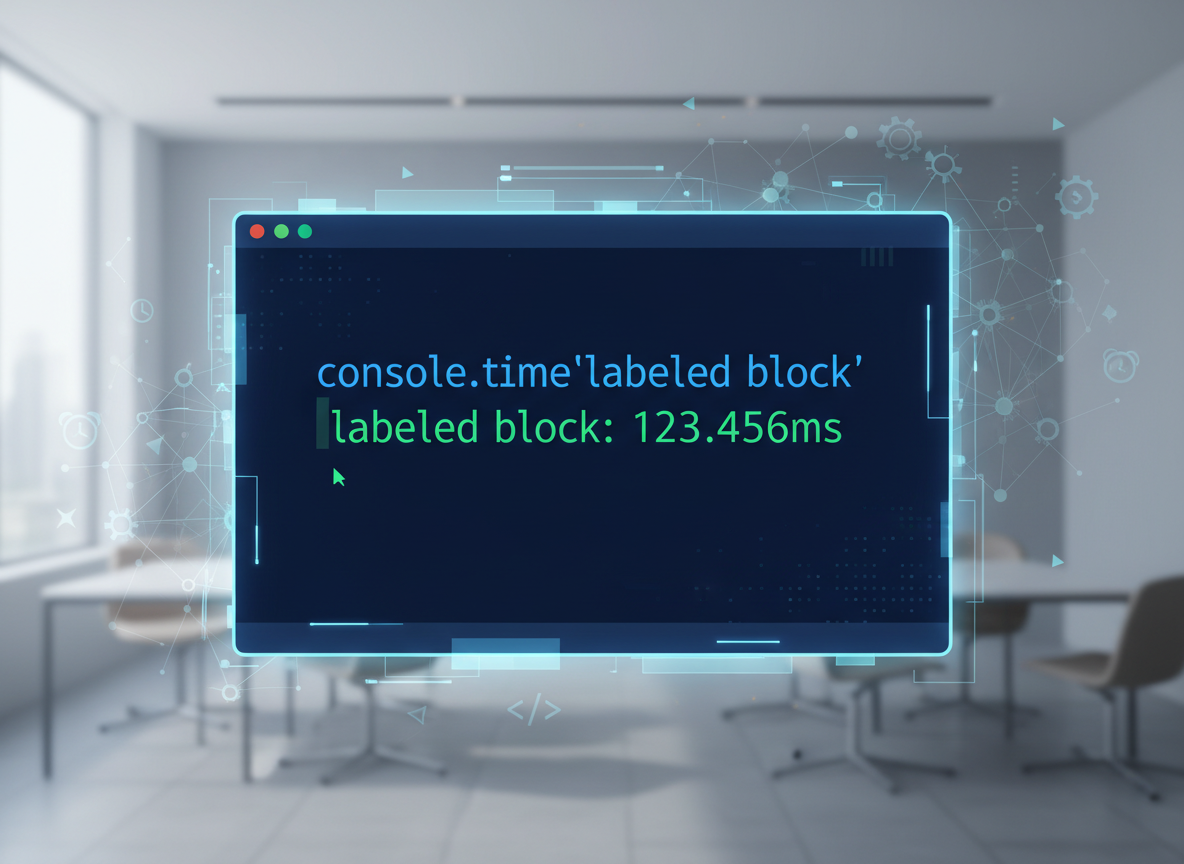
console.time demo
console.time prints how long the labeled block took. Great first step.
// Measure a small loop with console.time/timeEnd
console.time("sum");
let s = 0;
for (let i = 0; i < 100000; i = i + 1) {
  s = s + i;
}
console.timeEnd("sum");
console.log("sum value:", s);
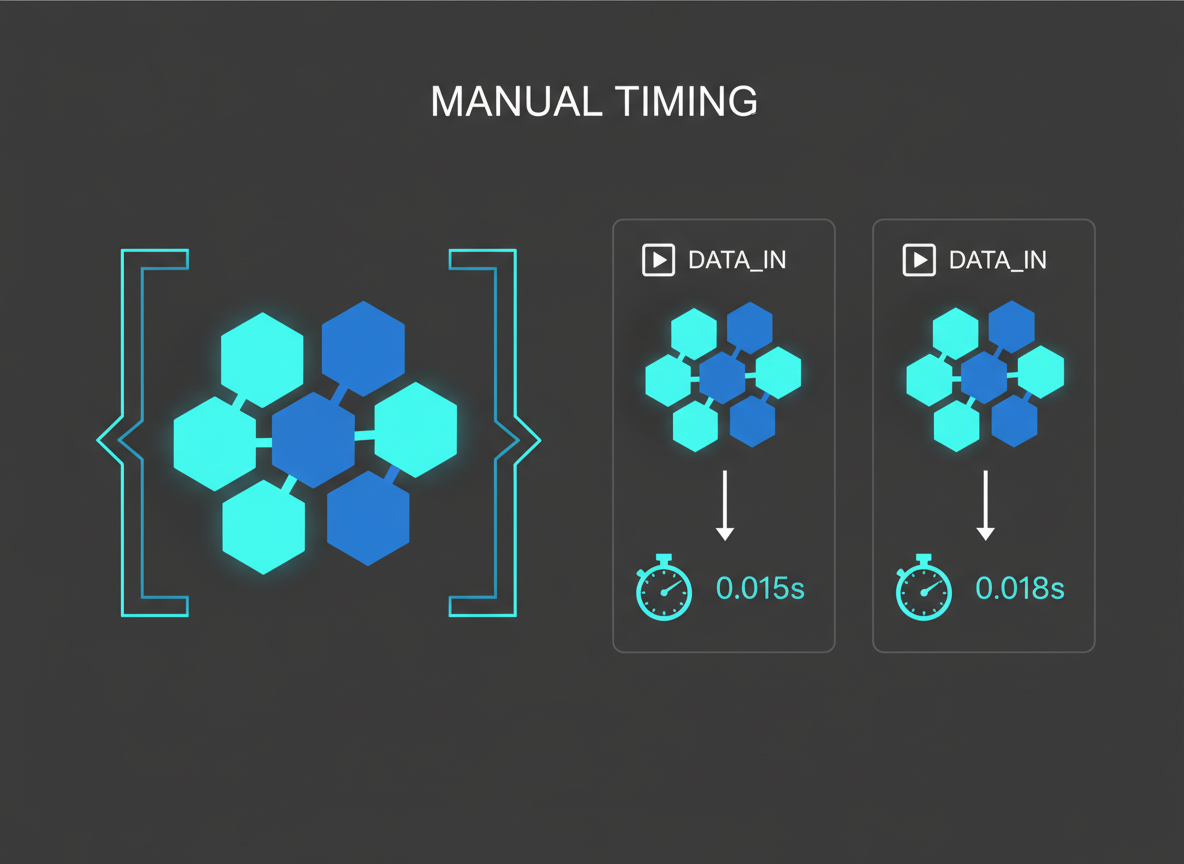
Manual timing helper
Manual timing helps you wrap any function and compare runs with the same input.
// A tiny now() helper that works in many runtimes
const now = (typeof performance !== "undefined" && performance.now)
  ? function () { return performance.now(); }
  : function () { return Date.now(); };

// Time a function manually
function timeFn(label, fn) {
  const t1 = now();
  const out = fn();
  const t2 = now();
  console.log(label + " ms:", (t2 - t1));
  return out;
}

timeFn("small work", function () {
  let x = 0;
  for (let i = 0; i < 50000; i = i + 1) { x = x + i; }
  return x;
});
Find hot code
Track calls and time to learn where your app spends work; optimize the hottest function first.
// Count calls and total time to find hot spots
const metrics = { calls: 0, totalMs: 0 };

function hotWork(n) {
  const t1 = now();
  let sum = 0;
  for (let i = 0; i < n; i = i + 1) {
    sum = sum + (i % 3);
  }
  const t2 = now();
  metrics.calls = metrics.calls + 1;
  metrics.totalMs = metrics.totalMs + (t2 - t1);
  return sum;
}

// Simulate usage
for (let k = 0; k < 5; k = k + 1) {
  hotWork(80000);
}
console.log("calls:", metrics.calls, "avg ms:", metrics.totalMs / metrics.calls);

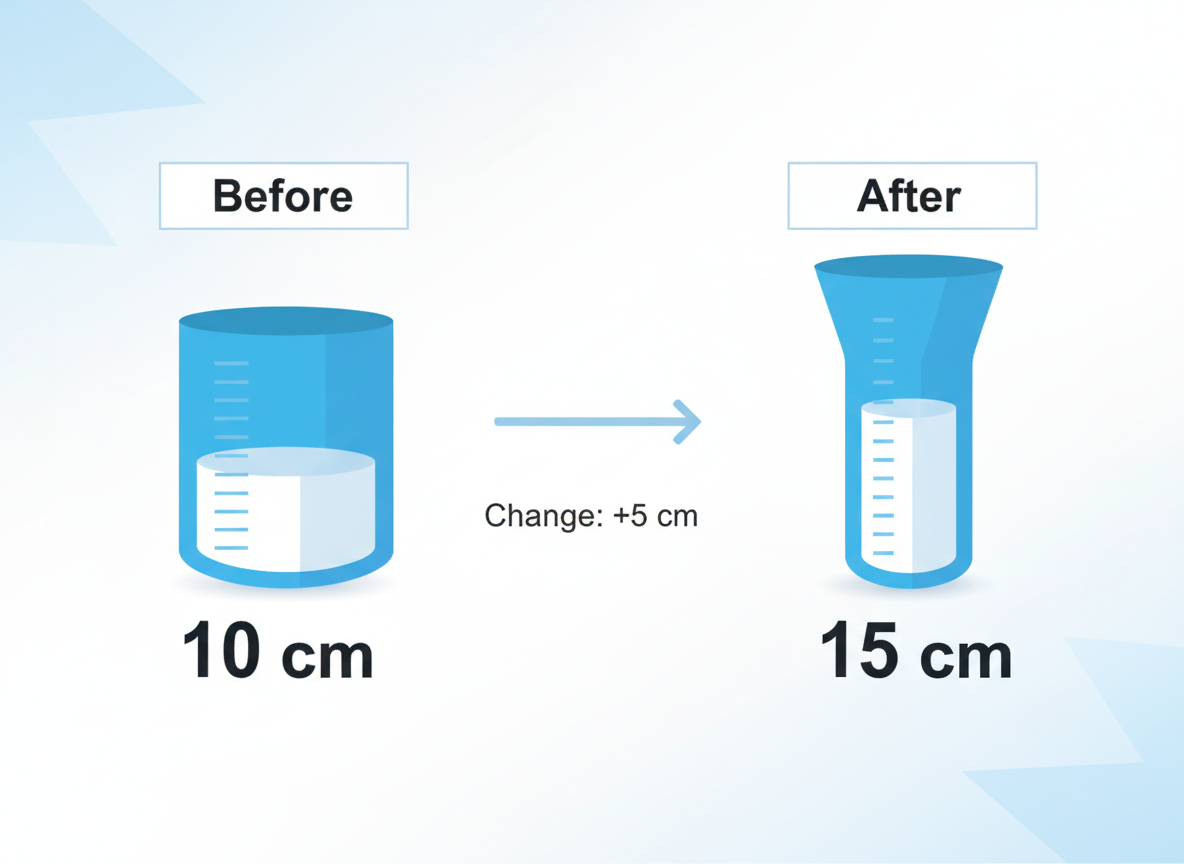
Before vs after timing
Measure before and after a change. Keep the same input and compare numbers only.
// Compare two approaches with the same input
const hay = [];
for (let i = 0; i < 2000; i = i + 1) { hay.push(String(i)); }

const needles = [];
for (let i = 0; i < 1000; i = i + 1) { needles.push(String(i * 2)); }

function slowIncludes() {
  let count = 0;
  for (const n of needles) {
    if (hay.includes(n)) { count = count + 1; }
  }
  return count;
}

function fastSet() {
  const set = new Set(hay);
  let count = 0;
  for (const n of needles) {
    if (set.has(n)) { count = count + 1; }
  }
  return count;
}

const c1 = timeFn("includes run", slowIncludes);
const c2 = timeFn("set.has run", fastSet);
console.log("counts:", c1, c2);
Good timing habits
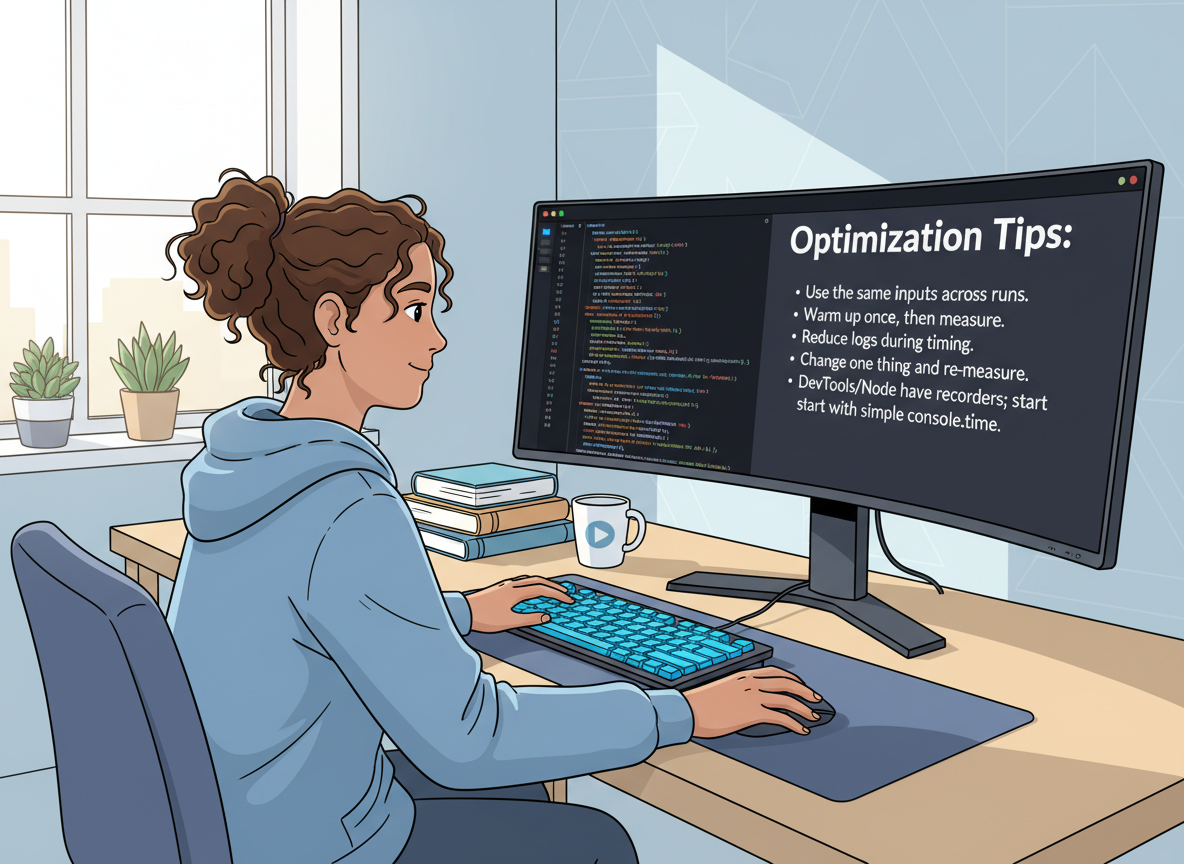
Tips:
- Use the same inputs across runs.
- Warm up once, then measure.
- Reduce logs during timing.
- Change one thing and re-measure.
- DevTools/Node have recorders; start with simple console.time.
console.time basics quiz
Quick check: Quick timing tool.

Recap
Recap: Start with console.time and a tiny now() helper. Find hot code, make a simple change, and re-measure with the same inputs.

Learn JavaScript with an AI tutor — free
Write and run real code in your browser, get instant help from a 24/7 AI tutor, and pick up where you left off on the web or in the app.
- Courses
- 59
- Lessons
- 200
Frequently Asked Questions
Is the “Profiling intro (Node/DevTools) — tiny timing habits” lesson free?
Yes — any 3 lessons of the JavaScript Academy learning path, including “Profiling intro (Node/DevTools) — tiny timing habits”, are free to read in full here on the web. After that, CoddyKit PRO unlocks every lesson, plus interactive practice with a built-in code editor and a 24/7 AI tutor. The JavaScript Academy course includes 3 lessons in total.
What will I learn in “Profiling intro (Node/DevTools) — tiny timing habits”?
Profile in tiny steps: measure with console.time/timeEnd and simple timers, find hot code, change one thing, and re-measure. You practise JavaScript Academy with hands-on code you run directly in the browser, and a 24/7 AI tutor answers your questions as you work through the lesson.
Do I need any experience to start JavaScript Academy?
No prior experience is required. JavaScript Academy on CoddyKit is structured for beginners through advanced learners, so you can start here or from the beginning and move at your own pace. This is lesson 3 of 3.
How long does the “Profiling intro (Node/DevTools) — tiny timing habits” lesson take?
Most CoddyKit lessons take about 5–10 minutes. Each one is bite-sized and interactive, so you make steady progress and pick up exactly where you left off across the web and the app.
Can I write and run code in this JavaScript Academy lesson?
Yes. Every JavaScript Academy lesson includes a built-in code editor, so you write and run real code right in your browser and get instant AI feedback — no local setup required.
All lessons in this course
- Big-O basics, hot vs cold paths (beginner wins)
- Avoiding leaks — closures, timers, references
- Profiling intro (Node/DevTools) — tiny timing habits